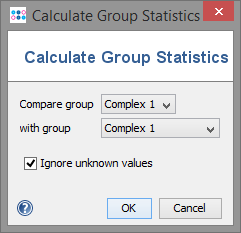
The Calculate Color Groups Statistic command allows to compare the distances of Samples in two color groups. This might be useful o check the distances between Samples of subtrees or between outbreak and non-outbreak Samples.
For each of the two color groups the following values are calculated based on the currently selected columns for distance calculation (if a group contains more than one Sample):
- Minimum distance within group
- Maximum distance within group
- Average distance within group
If both color groups contain Samples, the following additional values are calculated:
- Minimum distance between groups
- Maximum distance between groups
- Average distance between groups
- Average distance of Samples in first groups to closest Sample in second group


